Discussion
The full list of rubric scores can be found here. The purpose of the rubric development and application is to investigate whether story quality can be measured in a consistent and reproducible way.
Statistics
Here, we discuss the outcomes and interpretation of the statistical tools used in the analysis. The calculation procedure is explained here.
Cronbach's alpha
As such, Cronbach's alpha was calculated for the rubric results, yielding α = 0.78±0.01
Now, α=0 means the different tests (rubric axes) are completely unrelated, while α=1 means that the different tests (rubric axes) measure the exact same thing. As such, the interpretation of α = 0.78±0.01 requires some nuance. As this value is fairly high, the different rubric axes are clearly related by some underlying principle. However, as α is also significantly lower than 1, the different rubric axes also clearly measure distinct properties in a story. This result is exactly what we are hoping for. We do not want the different rubric axes to have nothing to do with each other. Why else would we combine them into the same rubric? But we also do not want them to measure the exact same thing. Why else would we need different axes? We want the axes to all measure different aspects of the same underlying property. α = 0.78±0.01 strongly suggests that this is the case.
Cronbach’s alpha does not identify what this latent dimension is. It only indicates that such a shared dimension is present. We hope that it is intrinsic story quality. But that cannot be extracted using Cronbach's alpha. Only that the rubric clearly contains some underlying property.
Spearman correlation
The Spearman correlation of the rubric (for all 30 stories) for two different rubric evaluations, was found to be ρ=0.92
This proves that ranking, based on the rubric score is highly stable. Again, it does not prove that the rubric indeed measures story quality, but we do know for sure that the rubric measures different aspects of some underlying property of stories (α = 0.78±0.01), and that ranking stories based on this underlying property is extremely stable (ρ=0.92).
Mean Relative Deviation (MRD)
The Mean relative Deviation was calculated to be MRD = 5.7 with rubric scores ranging from 0 till 100. The interpretation of this number requires some context. For the 30 stories investigated, scores range from MIN=34.1 to MAX=87.9 with μ=65.1 and σ=13.3
This means that the average fluctuation between repeated evaluations is substantially smaller than the natural spread in scores across stories. In other words, score differences between stories are not dominated by evaluation noise. This supports the interpretation that the absolute rubric score provides a meaningful distinction between stories.
Conclusion
We conclude that the rubric for Vikmione stories captures distinct aspects of a shared latent property (α = 0.78±0.01).
The absolute rubric score appears to provide a meaningful measure of that property (MRD = 5.7; σ=13.3), while ranking by rubric score is highly stable across repeated evaluations (Spearman ρ=0.92). But it remains to be seen whether this underlying property is indeed what we call 'intrinsic story quality'.
Correlation study
The correlation between Popularity and total rubric score was also investigated. Here, Popularity is defined as Correction × Hits / Time, where Correction is a factor between 0 and 1 that adjusts for the launch spike in the first months after publication. Further details are explained in our Methods. See the figure below for the correlation plot.
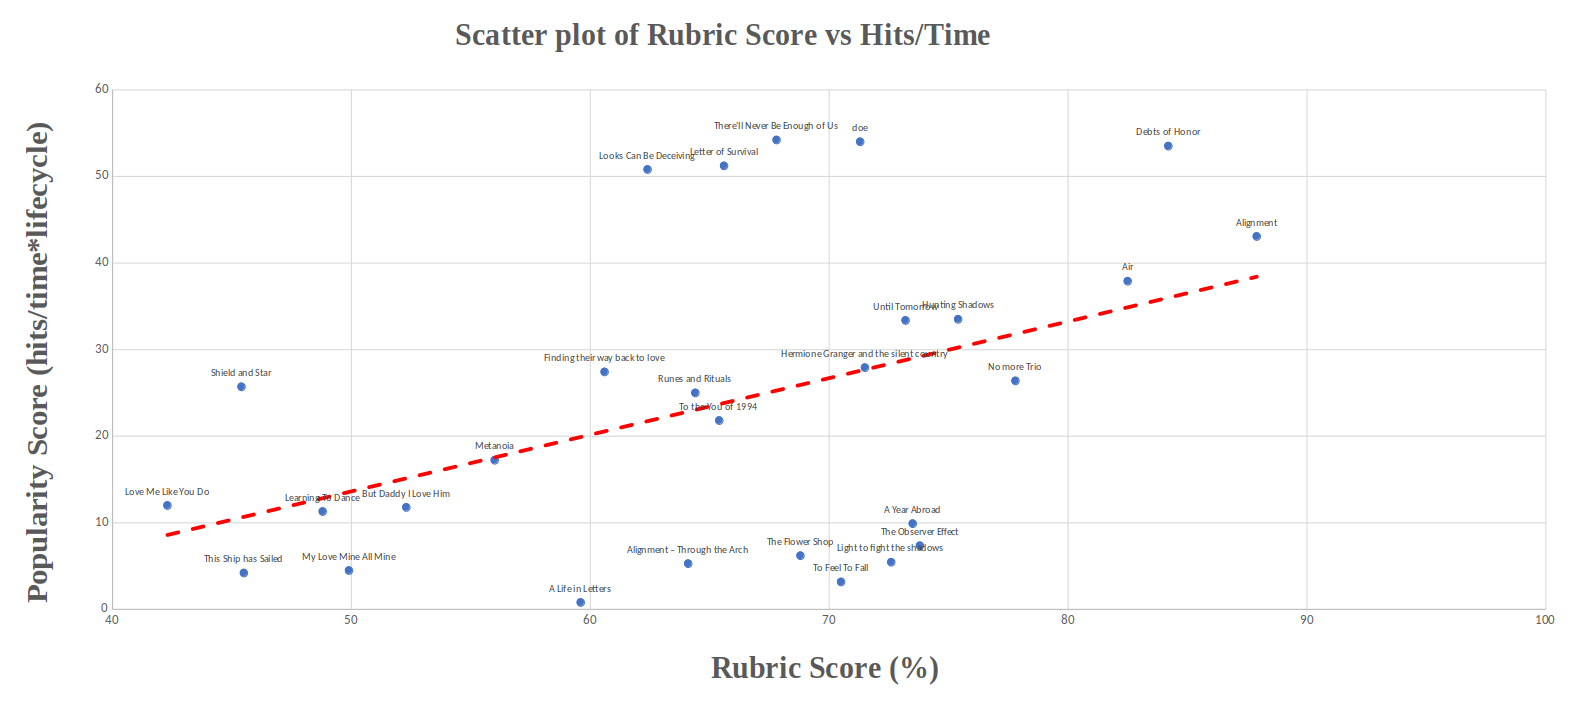
Figure: Correlation between rubric score and popularity (lifecycle*hits/time).
The figure shows each story in our dataset, labeled by its title. The following 2 stories were eliminated from the correlation study (making the total number of stories in the figure 28 instead of 30):
-
Flower of the North. This story has a way higher Popularity than it's Rubric score would suggest. However, the author explicitly writes in the comments of the story, that the story was used to test ideas that would be used in another novel; a novel that has nothing to do with Harry Potter. As such, it is reasonable to assume that the world and characters match that goal instead of an accurate Harry Potter Imitation. The Raw Data supports this hypothesis. The Canon Consistency rubric axis (score 1/10) and Worldbuilding rubric axis (score 3/10) are significantly lower than the other axis (mostly around 7/10). This makes sense, as both of these axes deal heavy penalties for canon contradictions, and they make up about 1/3 of the total rubric scores. The rubric was designed like this on purpose, as the scope of our analysis is canon-consistent serious vikmiones. However, that means that Flower of the North is probably misaligned to some extend with the scope of our analysis, causing the rubric score to turn out too low. Hence, the story does not have a bad quality, it is misaligned with our scope. As such, removal from the correlation study is justified.
-
All the Names of Waiting. This story states explicitly in its summary (for a large part during its history, but currently no more) that Hermione and Viktor are first torn apart by the war, and only find each other back after 12 years. The author of this story explicitly stated that many people strongly dislike this choice in the plot. Obviously, such a choice has nothing to do with the quality of a story; what matters is whether it is done right (the rubric is designed around this principle). But people's choices to read a story do depend heavily on such choices. As such, it is reasonable to assume that the Hits and Popularity of this story do not do it justice (that is why it is recommended as a hidden gem). Hence, also here, the normal relation between Popularity and Rubric score is clearly distorted, so we eliminate it from the correlation study.
Choice to eliminate a story from the correlation study are solely based on whether an explicite statement of the author was available as evidence/indication that the relationship between Popularity and Rubric score could be distorted. All stories where such statements were unavailable have just been taken along in the study. The resulting figure (for the remaining 28 stories) is shown above.
The Pearson correlation between Popularity (lifecycle*Hits/Time) and Total rubric score was found to be r=0.44
This is consistent with our hypothesis. We already know that the rubric measures different aspects of the same underlying principle (α = 0.78±0.01), which we hope to be intrinsic story quality. It stands to reason to assume that readers can recognise (to some degree) the intrinsic quality of a story, meaning that Popularity and Rubric score are expected to be positively correlated. However, Popularity is also expected to heavily depend on other aspects, such as peoples preference for certain plot choices and characterizations, and marketing/advertisement on social media. As such, a correlation that is significantly higher then zero, but far from close to one, is exactly what one would expect. And what was found with r=0.44
Furthermore, the fitted trendline also shows a clear positive slope (calculated with least squares method). The actual value has little meaning, as Popularity and Rubric score have different units. But depending on a good or bad rubric score, the trendline shows that popularity almost quadruples. This, together with r=0.44, forms a clear indication that the Rubric score indeed measures intrinsic quality.
Also note that the Rubric was designed to do this. All formulations of the rubric axes were designed in such a way to be as insensitive as possible to creative choices such as specific plots and characterizations, and as sensitive as possible to how well the concept was executed. As such, the rubric was aimed to measure execution or intrinisc story quality.
Obviously, the fact that the rubric was aimed to measure intrinisc story quality, and that the scores are correlated to Popularity with r=0.44 and a significant slope, is not a conclusive proof that the rubric indeed measures intrinisc story quality in an unbiased and reproducible way. But it is a clear indication. Which is the best result one can hope to achieve, as the notion of quality is different for each human being and, therefore, hardly objective.
Finally, the notion of rubric bias should be discussed. Our rubric used 10 different axes. However, who's decision should it be that these are the only 10 aspects of the underlying principle that we hope to be story quality? Or how heavily each of these 10 axes should be weighted? This is the principle of rubric bias: scores heavily depend on what the rubric deems important in a story. In normal rubric assessment, this problem is mitigated by aligning the rubric axes with the learning goals of the assessment (see here and here). We tried to mimic this principle by choosing axes related to common aspects of good storytelling (category A), axes that reflect the scope of our story (category B) and axes that reflect relationship dynamics (category C). And we verified (see parameters E and F in our rubric aggregation, and in the Raw Data) that the aggregated total score is a fair balance between emotions felt by the reader, and good plot and world design. Moreover, we explicitly formulated each axis in such a way that it is (hopefully) fair to creative choices and only judges how well those choices are executed. But we must admit that rubrics are, by design, always inherently biased.
As such, a nice follow-up reseacrh project would be to attempt to repeat the study with a second rubric that is developed for the same scope and datatset as this project, but that is developed completely independent from our rubric (by different people). We cannot do this ourselves, because that would defy the independent development. As such, if you like to contribute by providing such a rubric, create a pull request here.
Conclusion
The rubric appears to capture distinct aspects of a shared latent property in a meaningful and reproducible way. Cronbach’s alpha (α = 0.78±0.01) indicates internal structure, Spearman correlation (ρ=0.92) indicates ranking stability, and the low MRD relative to the score spread MRD = 5.7, σ=13.3) indicates that absolute score differences are meaningful rather than noise. The significantly positive correlation (r=0.44) with popularity, together with the rubric’s execution-focused design, makes it plausible that this latent dimension approximates intrinsic or execution quality. This remains an interpretation rather than a conclusive proof, as story quality is inherently subjective.